CE Certification
This product is certified in accordance with the CE and UKCA requirements. A copy of the Declaration of Conformity can be downloaded from ictinternational.com/ce
Product Overview
Introduction
The SFS Sap Flow Sensor precisely measures plant water use using Heat Ratio Method (HRM). Providing calculated sap velocities, the sensor can also provide raw needle temperature for post-processing.
Delivering six key metrics via SDI-12 v1.4, including sap flow rates and velocities, with low power consumption, and a rugged multi-probe design, it’s built for long-term field use in agriculture, forestry, and ecology.
Product Specification
| Voltage Input | 9-24 V |
|---|---|
| Maximum Current at 12V | 50 mA |
| Power Consumption | 2.635 Wh/day |
| Minimum Measurement Interval | 10 minutes (recommended) |
| Communication Interface | SDI-12 |
| Measurement Accuracy | 0.5 cm/hr |
| Measurement Resolution | 0.01 cm/hr |
| Needle Options | 12 mm, 22.5 mm and 35 mm |
| Enclosure Dimensions | 150 x 100 x 75 mm (L x W x H) |
Figure 1: Product Specification
Power States
| Power States | Current Drawn (at 12V) |
|---|---|
| Charging | 50 mA |
| Active | ~ 4 mA |
| Sleeping | ~ 2 mA |
Table 1: SFS Power States
The Sap Flow Sensor (SFS) requires continuous power from the logger to operate correctly. Configure the logger so that the sensor always remains powered, even when the logger enters low‑power modes.
What’s in the box
Standard Inclusions
| Inclusions | Sensor Model | ||
|---|---|---|---|
| SFS-12 | SFS-22.5 | SFS-35 | |
| Probe Set |
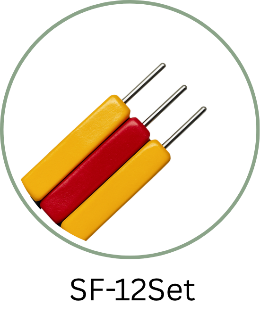 SF-12Set |
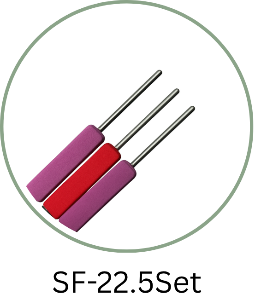 SF-22.5Set |
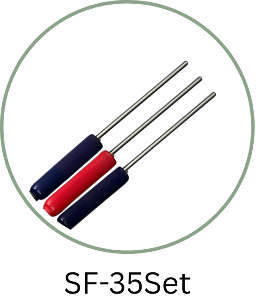 SF-35Set |
| Sensor Unit |

|
||
| Sensor Cable | 10 m (standard) | ||
Table 2: Standard Inclusions
Options
Extra Probe Sets – SF12Set/ SF22.5Set/ SF35Set
Test Block – SF-TB
Probe Extension Cables – 1m
Sensor Extension Cables – 1m/ 10m/ 20m
Operation and Measurement
Electrical Wiring
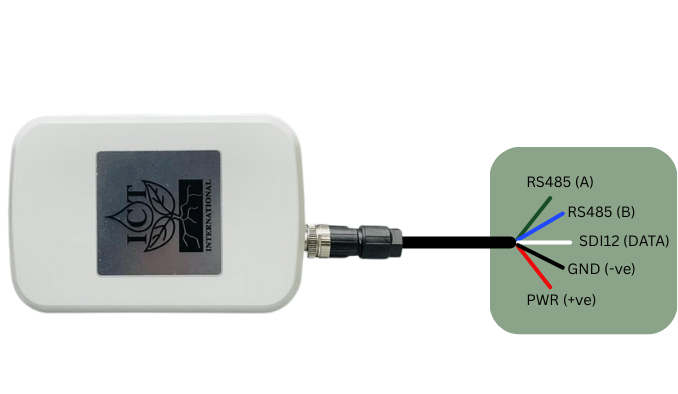
Figure 2: SFS Wiring Configuration
| Input/Output | Wire Colours | Comment |
|---|---|---|
| Power | Red | Voltage Range: 9-24V |
| Ground | Black | |
| Data (SDI-12) | White | |
| RS485 (A) | Green | Firmware Upgrades Use Only |
| RS485 (B) | Blue |
Table 3: SFS Electrical Specification
Getting started
Connect the sap‑flow sensor to any SDI‑12 v1.4‑compatible data logger using the wiring in Figure 2.
Send the address query ?! to confirm the sensor is responding.
Then request its identification string aI! to verify the sensor’s model and serial number.
Once communication is confirmed, you can prepare the required SDI‑12 program or script before installing the system in the field.
For guidance on writing logger programs and integrating the sensor with different platforms, please refer to the following documents:
| Documentation | Description |
|---|---|
| Campbell Logger Guide | Instructions for configuring and programming Campbell Scientific data loggers for SDI‑12 sensors. |
| Halytech Logger Guide | Setup and scripting guidance for using the sensor with Halytech loggers. |
| Campbell Scripts (GitHub) | Example SDI‑12 scripts and templates for Campbell loggers, available in the project’s GitHub repository. |
ICT International recommends bench testing the unit before installation.
Sensor Test
Place the probes in the optional test block to keep them steady. After the logger powers the sensor, open the logger’s terminal so you can send SDI‑12 commands. Run a manual measurement, wait for the sensor to signal that the reading is ready, and then retrieve the values. If the numbers look correctly formatted, stable, and sensible, the sensor is wired properly and ready for installation.
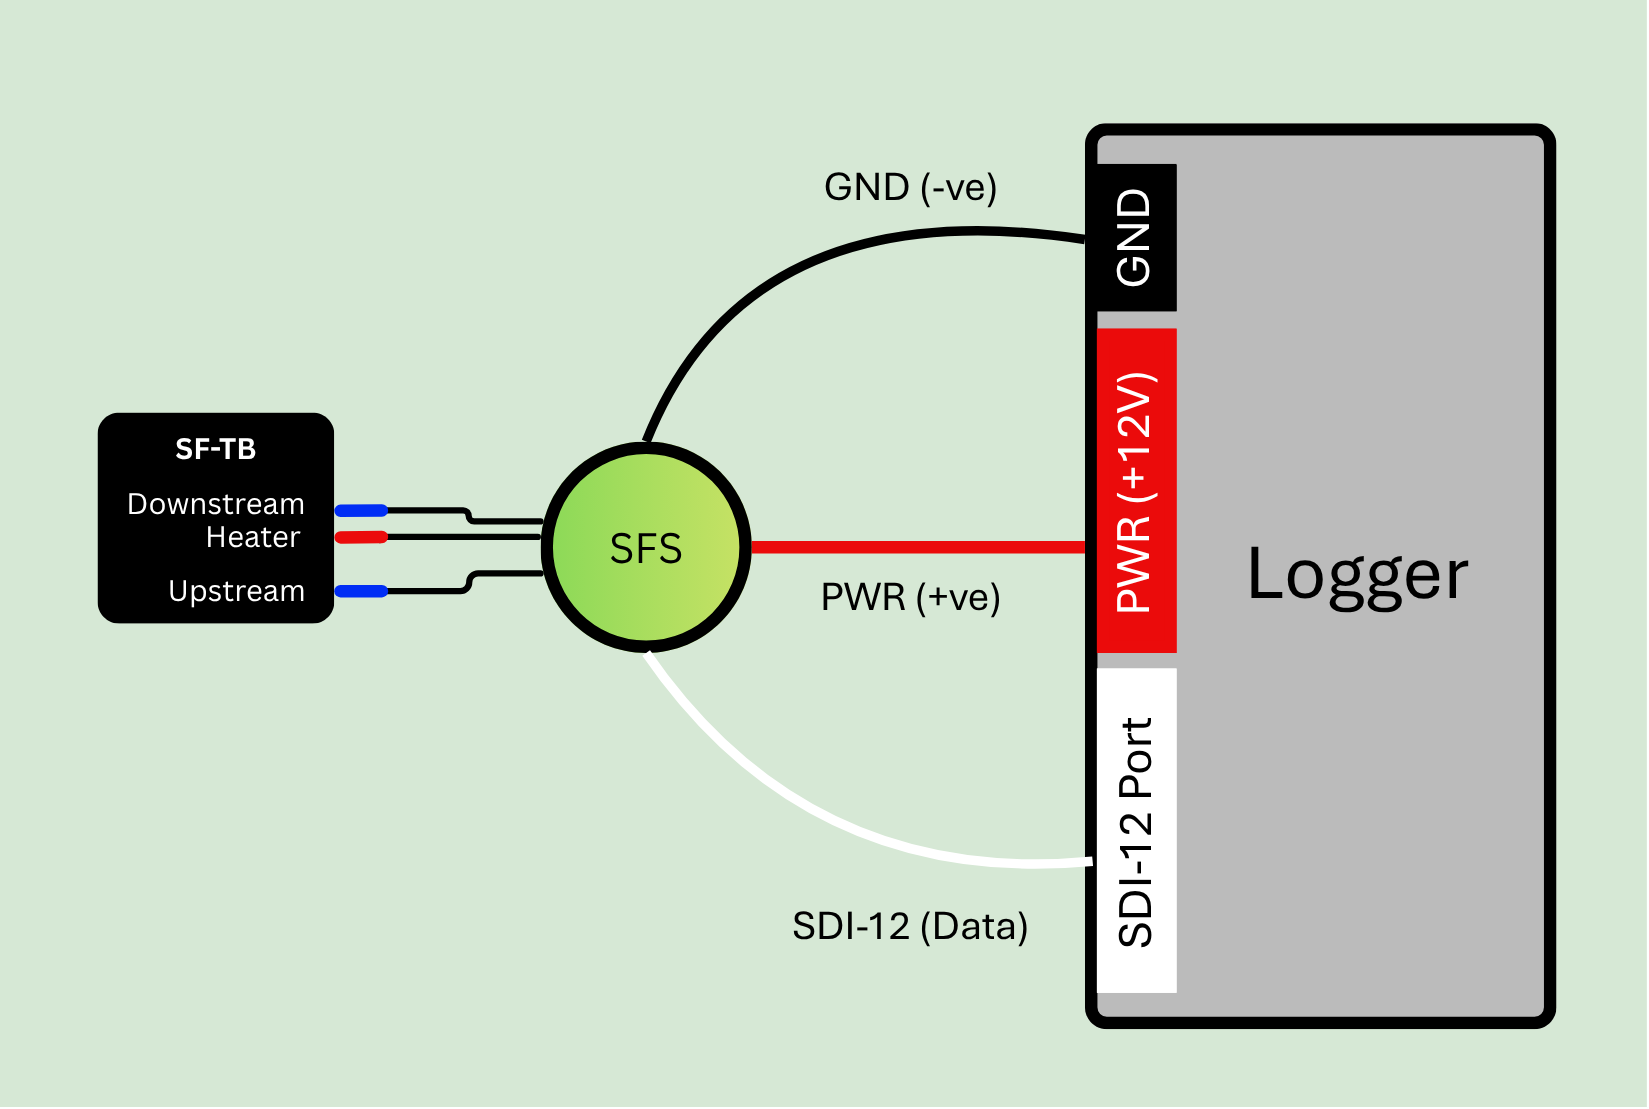
Figure 3: SFS Test Setup
| Logger | Example SFS Response | Description |
|---|---|---|
| ?! | 0 | Sensor Returns Address = 0 |
| 0I! | 014ICT-INTLSFSMPC1.2Q1001 | Sensor Information |
| 0C! | 015609 | Logger must wait 156 seconds to get 9 results |
| 0D0! | 0+10.677+10.543 | Uncorrected Outer and Inner Heat Pulse Velocities |
| 0D1! | 0+19.345+19.123 | Corrected Outer and Inner Heat Pulse Velocities |
| 0D2! | 0+13.456+13.221 | Corrected Sap Flow Velocities |
| 0D3! | 0+03.000+00.000 | Needle Verification codes (section 5.4) |
| 0D4! | 0+00.000 | Temperature Diagnostics (section 5.4) |
Table 5: Test Example
SDI-12 Commands
Basic Commands
| Command Name | Command | Description |
|---|---|---|
| Acknowledge Active | a! | Sensor active check |
| Send Identification | aI! | Send identification information |
| Address Query | ?! | Used when the address is unknown to have the sensor identify its address |
| Change Address | aAb! | Changes the address of the sensor from a to b |
| Start Measurement | aM! (Measurement Command) 383 seconds |
Tells the sensor to take a measurement |
aC! (Concurrent Command) 156 seconds |
Used to take a measurement when more than one sensor is used on the same data line | |
| Send Data | aD0! (uncorrected outer and inner HPV) |
Retrieves the data from a sensor |
aD1! (corrected outer and inner HPV) |
||
aD2! (corrected outer and inner Sap Velocity) |
||
aD3! (Heater and Thermistor Verification Code) |
||
aD4! (Temperature Diagnostics) |
||
| Baseline Temperature | aC1! 30 seconds average |
Performs Baseline Temperature Measurement |
| Trigger Heat Pulse | aC2! 10 seconds |
Performs a heat pulse |
| Raw Thermistor Data | aC3! 10 seconds |
Performs Raw Thermistor Data Measurement |
| Supercapacitor Voltage | aC4! | Performs Supercapacitor Voltage Check |
| Heater Voltage | aC5! | Performs Heater Voltage Check |
| Board Temperature | aC7! | Performs Board Temperature Check |
Table 6: Basic SDI-12 Commands
Extended Commands
| Command Name | Command | Description |
|---|---|---|
| Verification Command | aV! | Checks heater, thermistor and temperature rise diagnostics |
| High Volume Command |
aHA! 143 seconds
|
Sensor takes measurement and returns raw thermistor readings that followed the heat pulse. The total measurement time is 143 seconds |
| Configure Thermal Diffusivity | aXTD=<value>*! | Change the thermal diffusivity. By default, it is set to 0.0025 cm/s |
| Configure Heater-to-measurement probe distance | aXHD=<value>! | Change the heater-to-measurement probe distance. By default, it is set to 0.5 cm |
| Configure Baseline Asymmetry Offset | aXBO=<value>! | Change the Baseline Asymmetry Offset. By default, it is set to 0 cm/hr |
| Configure Wound Diameter | aXWD=<value>! | Change the Wound Diameter. By default, it is set to 0.20 cm |
| Configure VS (i.e. Sap Velocity) Factor | aXVS=<value>! | Change the VS Factor. By default it is set to 0.64347 |
Table 7: Extended SDI12 Commands
SDI-12 Measurement Modes Comparison
| Feature | Standard (M) | Concurrent (C) | High-Volume (H) |
|---|---|---|---|
| Measurement Behaviour | Sensor performs measurement immediately after receiving the command | Sensor begins measurement but releases the bus so other sensors can also measure | Sensor performs a measurement that produces a large dataset |
| Bus Usage | Bus is occupied until measurement time is returned | Bus is free during measurement; multiple sensors can measure simultaneously | Bus is occupied during data transfer due to large data size |
| Data Size | Small, fixed number of values | Small, fixed number of values | Large datasets (up to 999 values), ASCII or binary |
| Intended Use | Routine measurements; simple sensors | Multi‑sensor networks; time‑coordinated sampling | Sensors producing high‑density or complex data |
Table 8: SDI-12 Measurement Modes Comparison
Sensor configuration options
The SFS is a versatile unit that can be used with other SDI-12 sensors or in conjunction with other SFS (or a hybrid of these).
By default, the SFS is shipped with the address as 0, therefore it may be necessary to change the address configuration. When using multiple SFS sensors on a logger’s SDI‑12 port, start by connecting each sensor one at a time and assigning it a unique address (by default each SFS will have addresses set to “0”). This may be necessary with other sensors that are connected to the data logger as well to avoid clashes.
Using multiple sensors to measure the Soil, Plant and Atmosphere Continuum: Multi‑Sensor Measurement Timing
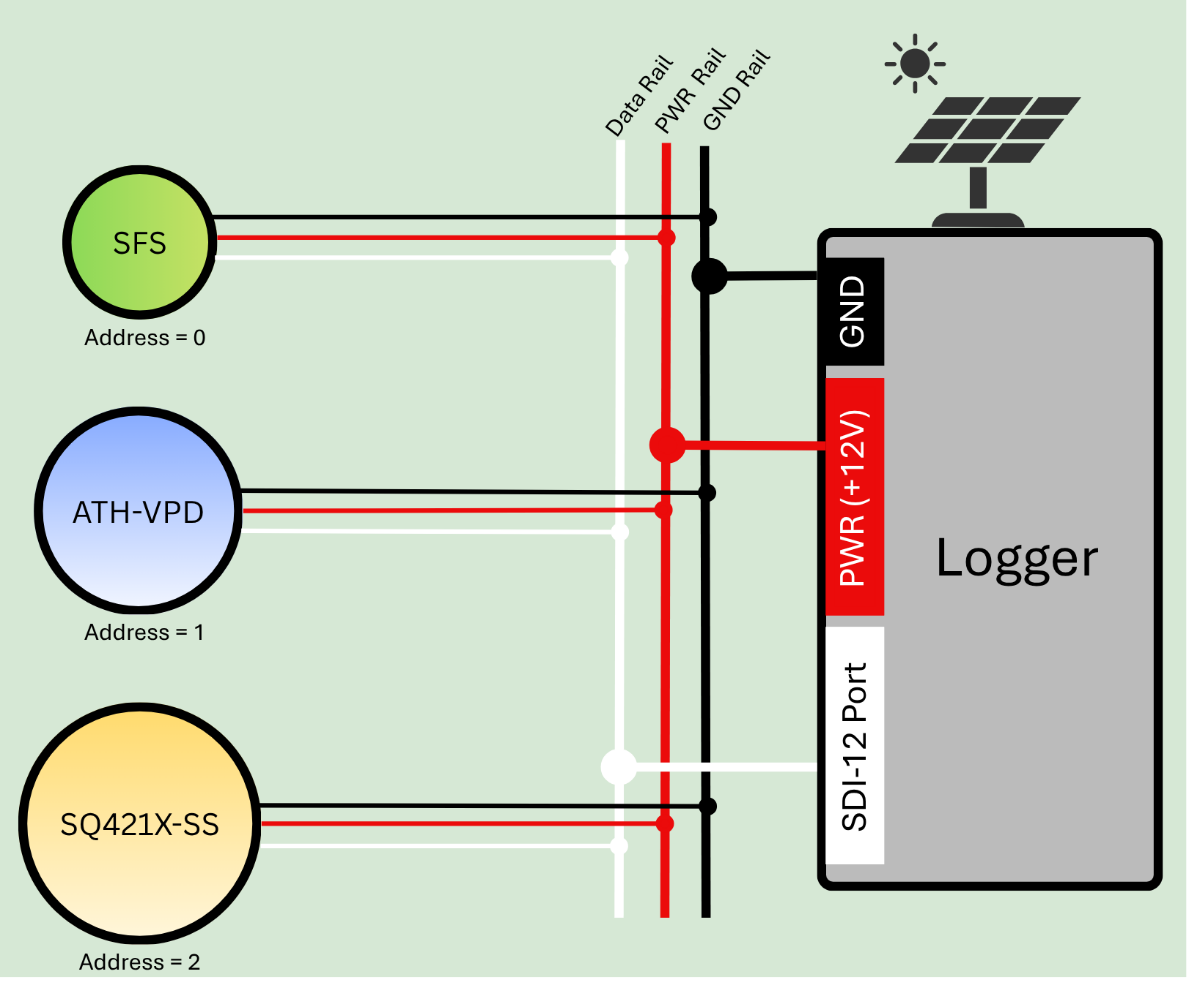
Figure 4: Multi-sensor setup
Measurement Timing and Sensor Coordination
When multiple SDI‑12 sensors share the same measurement cycle, it is important that their measurement windows are aligned so the resulting dataset represents a single, coherent point in time. In this system, the SFS sap flow sensor has the longest measurement duration, while the ATH‑VPD and SQ421‑SS complete their measurements within only a few seconds. For this reason, the SFS must always be triggered first.
- SFS Measurement (Address 0)
The SFS begins its measurement at the start of the cycle. A full SFS measurement requires approximately 156 seconds to complete. During this period, the sensor performs ADC initialization, heating, and internal processing. No other sensors should be triggered until the SFS measurement window has finished.
- ATH‑VPD Measurement (Address 1)
Once the SFS measurement has completed, the ATH‑VPD sensor can be triggered. This sensor requires only a few seconds to return valid data. Its measurement window should be scheduled immediately after the SFS window so that its data represent the same environmental conditions at the end of the SFS cycle.
- SQ421‑SS Measurement (Address 2)
The SQ421‑SS PAR sensor also completes its measurement within a few seconds. It should be triggered directly after the ATH‑VPD, ensuring that all fast‑responding sensors capture conditions at nearly the same moment.
Example Timing Sequence:
If a measurement cycle begins at 10:00:00 a.m.:
SFS completes its measurement at approximately 10:02:36 a.m.
ATH‑VPD completes its measurement a few seconds later
SQ421‑SS completes shortly after the ATH‑VPD
Because the fast sensors are triggered immediately after the SFS measurement window, all three sensors effectively represent a common measurement time of approximately 10:03 a.m.
This sequencing ensures that all sensor outputs are aligned to the same physical moment, providing consistent and synchronised data for analysis.
Using multiple SFS sensors
Depending on how the SFS is connected to the datalogger there are different approaches to the measuring multiple SFS.
If wired on a single port (e.g. bussed) then it is necessary to use the concurrent command
If each SFS is connected to an individual port, then they can be measured using the standard measurement command.
Concurrent Measurement
Set up the program in the logger so it sends the aC! command to each sensor in sequence. Include a 156‑second delay to allow all measurements to finish. After that, poll each sensor using the aD0!, aD1!, and aD2! commands. Once the data is returned, save it to the logger’s internal memory or an external memory card.
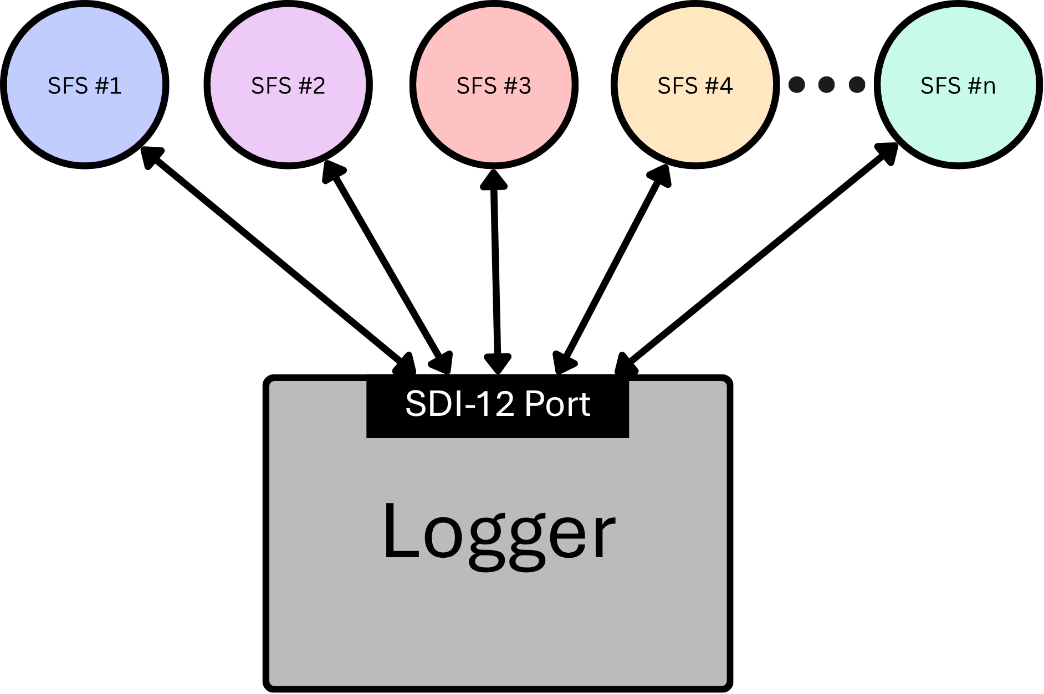
Figure 5: Concurrent Example
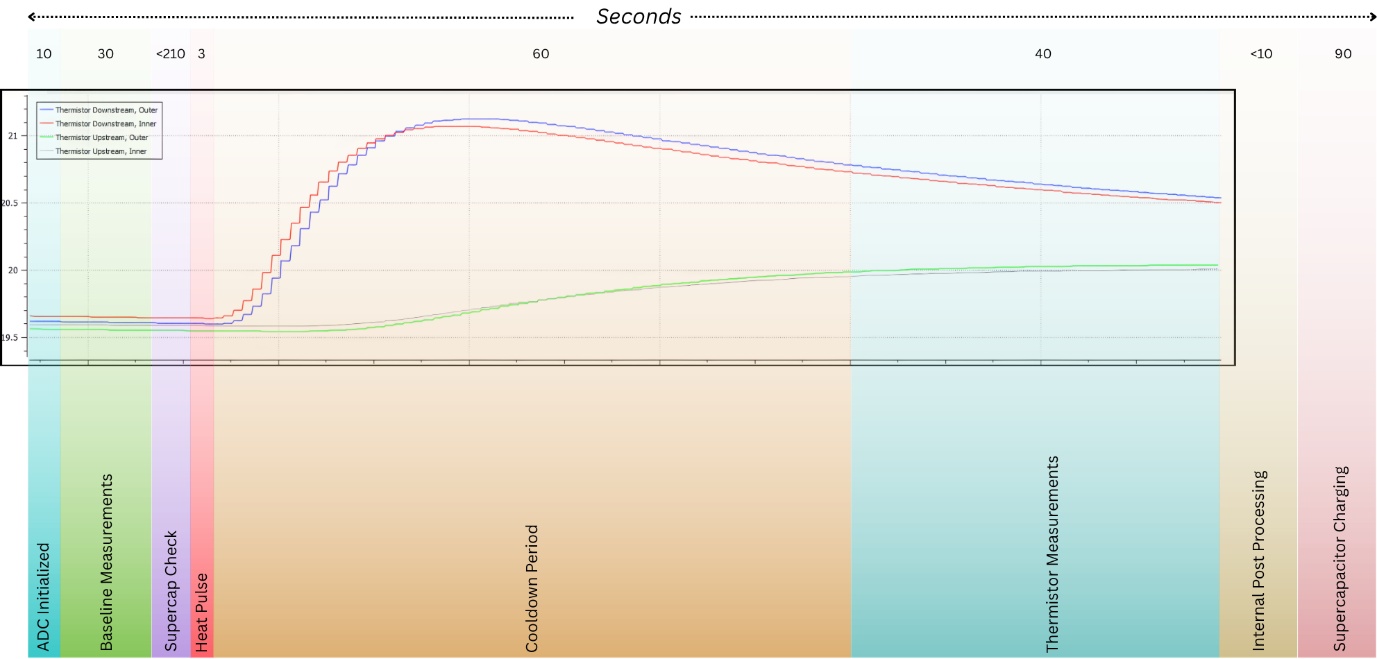
Figure 6: HRM Measurement Cycle
Note, a Concurrent HRM command variant (e.g. aC!) will abort if it exceeds 156 seconds. Hence the supercapacitors must be fully charged before initiating the command. A Standard HRM command variant (e.g. aM!) is 383 seconds to ensure that even a fully depleted supercapacitor bank will charge before a measurement, and the measurement will complete.
Standard Measurement
Using the standard aM! measurement command, the logger will trigger each sensor one at a time. SDI‑12 does not allow multiple sensors to run M! measurements concurrently on the same bus, so each sensor must complete its full measurement cycle before the next one is started.
An SFS requires up to 383 seconds to complete a measurement command, including the time needed to recharge its supercapacitor bank. Because each sensor must finish before the next can begin, the total measurement time increases with every additional sensor. For example, six sensors would require more than 38 minutes to complete a full sequence, which makes this approach unsuitable for applications with tight timing requirements or frequent sampling intervals.
After each sensor completes its measurement, the logger can retrieve the results using aD0!, aD1!, and aD2!, and then store the returned values in internal or external memory.
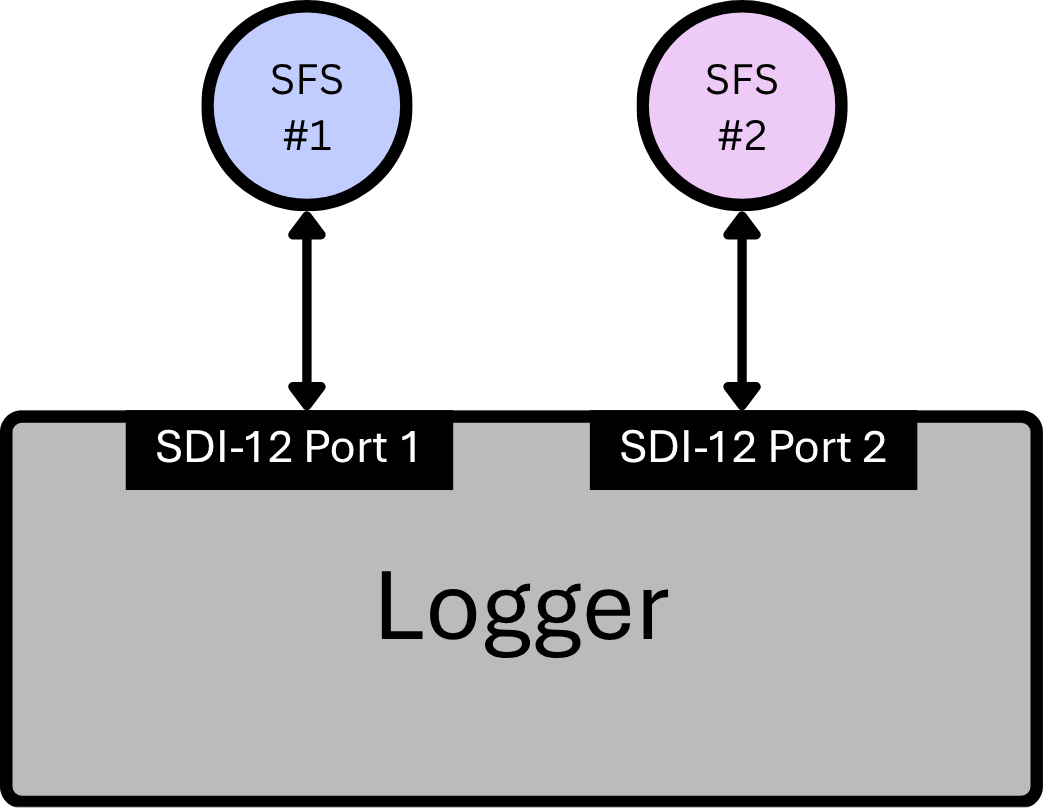
Figure 7: Sensor Logger Setup (for aM! command)
Note: Use the Measurement command when your sensor logger setup includes two or more SDI‑12 ports, with each SFS connected to a separate SDI-12 ports. This command is especially helpful when:
The logger cannot add delays between measurements, and
The logger’s power is only active during measurement.
In these situations, the Measurement command ensures that every SFS on each SDI‑12 port can take a reading and properly charge its supercapacitor bank.
High Volume Measurement for research purposes
The 0HA! command asks the sensor at address 0 to begin a High‑Volume ASCII measurement. When the sensor receives this command, it immediately replies with a short status message—for example: 0143480.
This response contains three pieces of information:
Sensor address: 0
Time remaining until the full dataset is ready: 143 seconds
Total number of data points that will be available: 480 values
These 480 values are temperature readings collected once per second from four thermistor channels. The data is arranged in repeating groups of four:
- Thermistor 1 OUT – every \(4n^{th}\) value (\(\color{blue}{\text{blue}}\))
- Thermistor 1 IN – every \((4n + 1)\) value (\(\color{green}{\text{green}}\))
- Thermistor 2 OUT – every \((4n + 2)\) value (\(\color{orange}{\text{orange}}\))
- Thermistor 2 IN – every \((4n + 3)\) value (\(\color{pink}{\text{pink}}\))
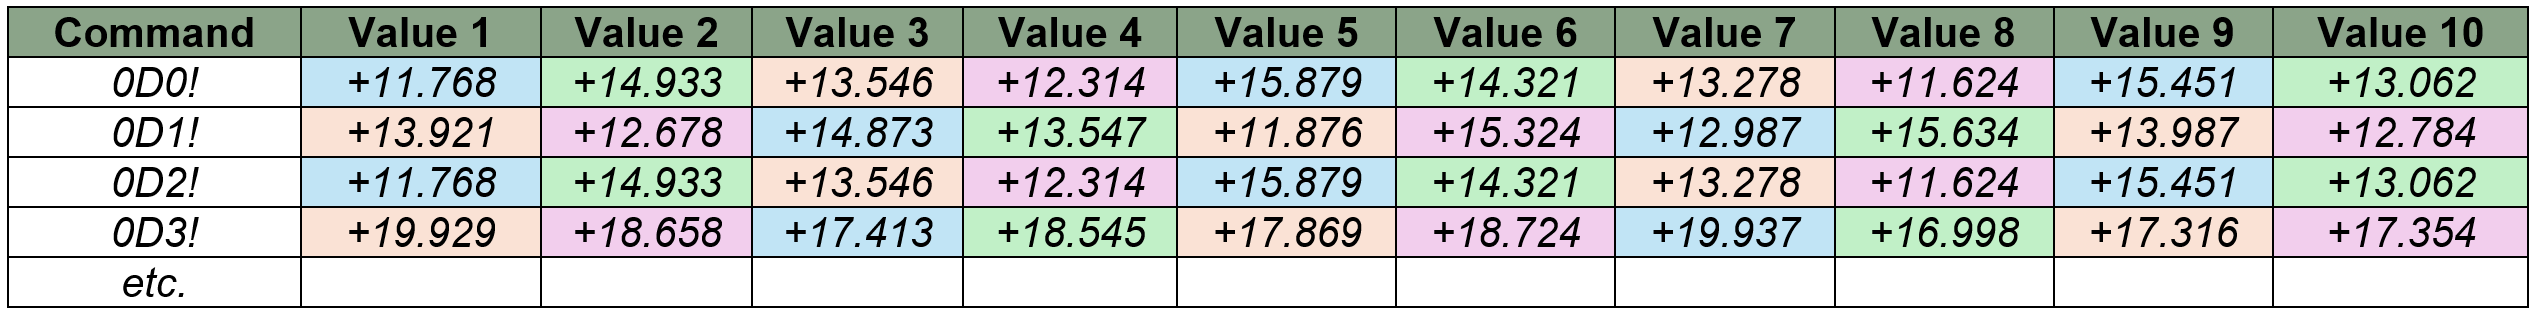
Table 9: Raw Data Visualization
Each index in the dataset corresponds to the number of seconds that have passed since the heat pulse began. Once this sequence finishes, the complete set of thermistor readings is ready to be retrieved.
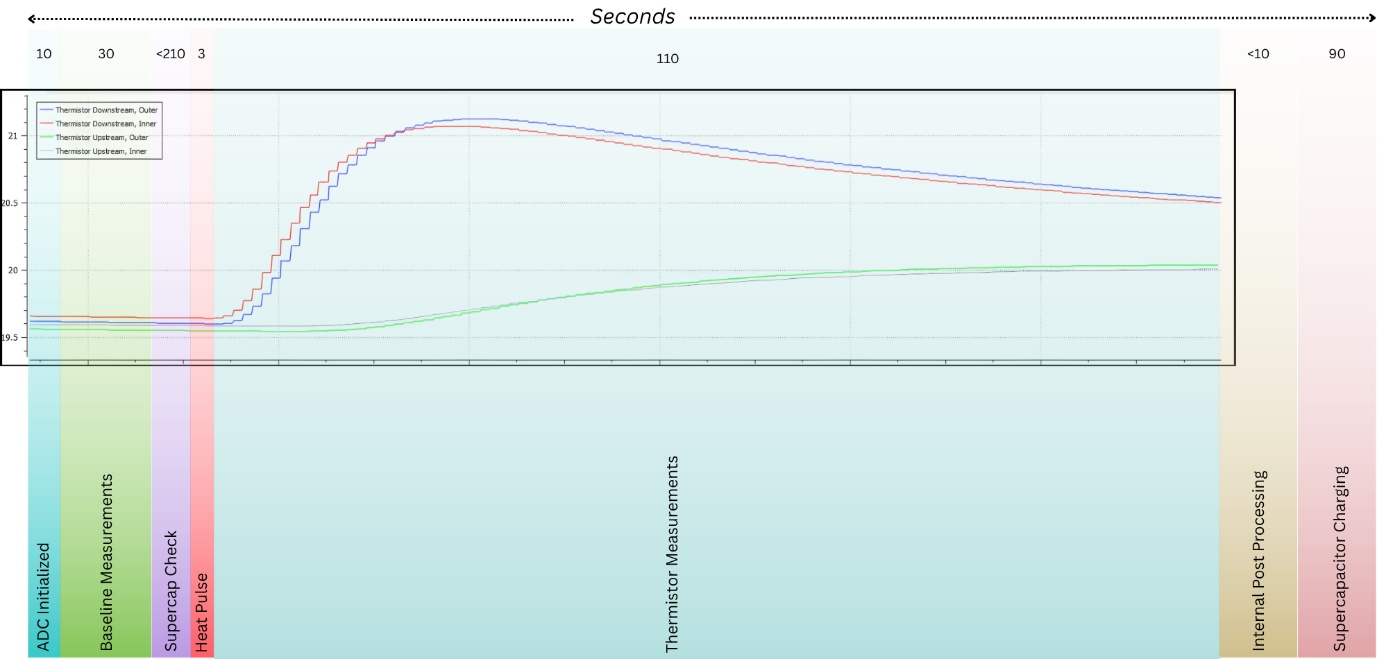
Figure 8: Raw Data
Note, a High-Volume raw data (aHA!) command will abort if it exceeds 143 seconds. Hence the supercapacitors must be fully charged before initiating the command.
Maintenance and Support
Serial Number Identification
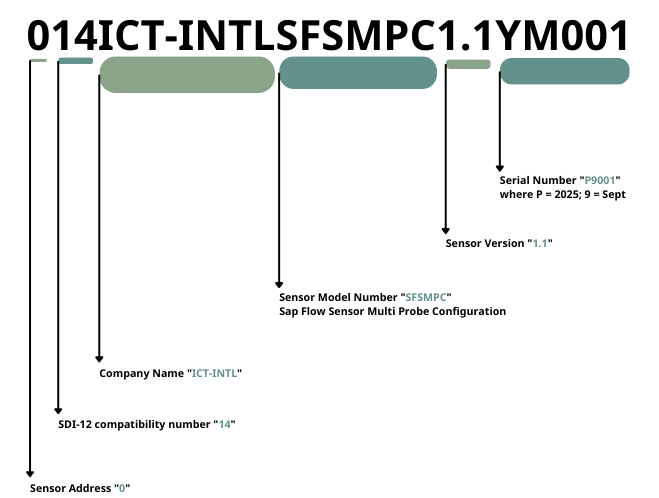
Figure 9: Serial Number Identification
Firmware Upgrade
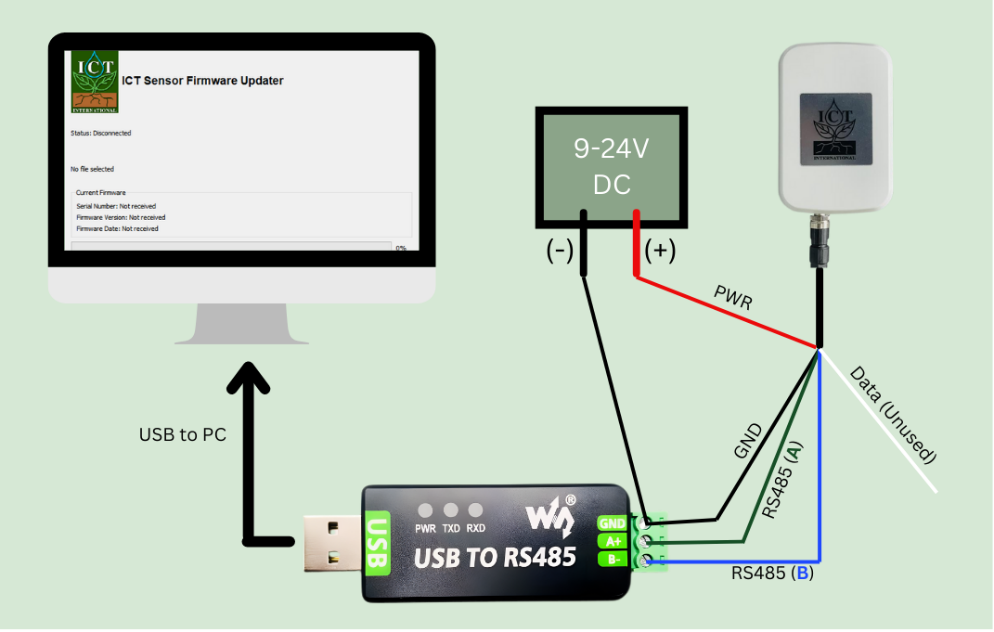
Figure 10: SFS Firmware Update Process
For the SFS firmware update process the following tools are required:
Industrial USB to RS485 Converter - https://www.waveshare.com/product/usb-to-rs485.htm
DC Power Source 9-24V Rated
ICT Sensor Firmware Updater v1.1.0 – provided by ICT International
Latest Sap Flow Sensor Firmware (.sfs) file – provided by ICT International
After wiring the sensor as shown in Figure 5.1, launch the ICT Sensor Firmware Updater on a Windows PC running Windows 10 or later.
- Click the “Select File” button on the software and open the latest firmware .sfs file from file explorer
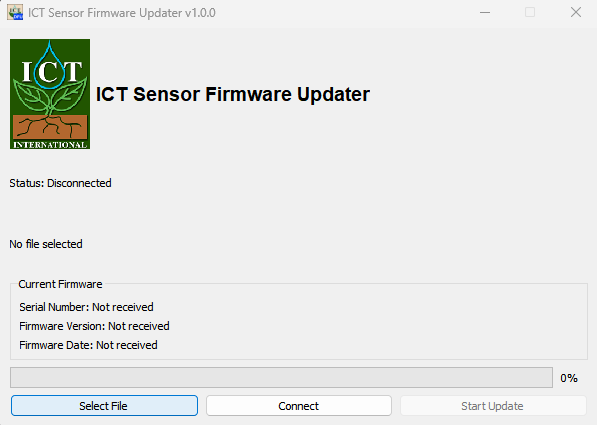
Figure 11: Select the firmware file
- Click the “Connect” button on the software
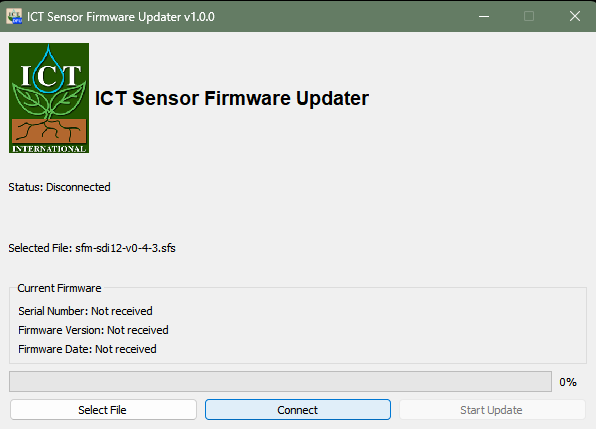
Figure 12: Connect the sensor
- Once connected the Current Firmware section of the software will populate with the current firmware version of the sensor, click “Start Update”
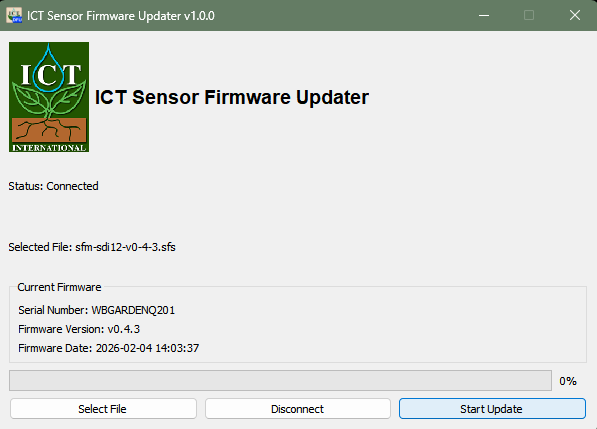
Figure 13: Start Update process
- Once the “Status” of the software changes to “Done”, click “Disconnect”
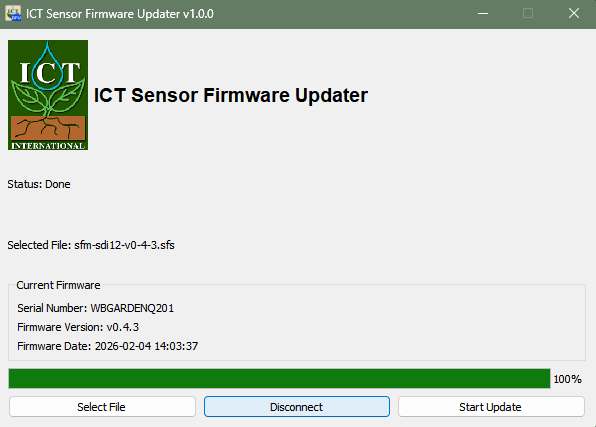
Figure 14: Disconnect the sensor from the software
- Switch off the power supply before unplugging the sensor
Note: the sensor is shipped with the latest firmware available when manufactured – use the Serial number to check date of Manufacture against FW release history on GitHub.
Customer Repairs
| Connectors | ICT P/N | Supplier P/N | Supplier Name |
|---|---|---|---|
| Thermistor Probes | Connect-F | 1441066 | Phoenix Contact |
| Heater Probe | Connect-M | 1441024 | |
| Data Cable | DataConnect-C | 1424649 |
Table 10: Customer Repair Parts
Diagnostic Commands
Heater Diagnostics Codes
| Value | Shorthand | Meaning |
|---|---|---|
| -2 | Heater Needle Determined | This is the default code for a sensor that has not yet run a heat pulse. |
| -1 | Determination Error | Caused by an inability to detect a stable heat pulse. |
| 0 | Needle Short Error | A possible short has occurred or needle resistance is very low. |
| 1 | 35mm Heater Detected | The 18 ohm, 35mm heater needle has been detected. |
| 2 | 12mm Heater Detected | The 8 ohm, 12 mm heater needle has been detected. |
| 3 | 22.5mm Heater Detected | The 13 ohm 25.3mm heater needle has been detected. |
| 4 | Open Circuit Error | Likely no needle attached / poor connection made. Reconnect needle. |
Table 11: Heater Diagnostics Code
Thermistor Diagnostics Codes
| Value | Meaning | Suggested Action |
|---|---|---|
| -1 | Thermistors undetermined | This is the default code for a sensor that has not yet run measurement that uses the ADC. |
| 0 | All Thermistors valid | None |
| 1 | Downstream probe partially disconnected or broken. | Reconnect the downstream thermistor probe. |
| 2 | Downstream probe partially disconnected or broken. | Reconnect the downstream thermistor probe. |
| 3 | Downstream probe fully disconnected or broken. | Reconnect the downstream thermistor probe. |
| 4 | Upstream probe partially disconnected or broken. | Reconnect the upstream thermistor probe. |
| 5 | Upstream and downstream probes partially disconnected or broken. | Reconnect both thermistor probes. |
| 6 | Upstream and downstream probes partially disconnected or broken. | Reconnect both thermistor probes. |
| 7 | Downstream probe fully and upstream probe partially disconnected or broken. | Reconnect both thermistor probes. |
| 8 | Upstream probe partially disconnected or broken. | Reconnect the upstream thermistor probe. |
| 9 | Upstream and downstream probes partially disconnected or broken. | Reconnect both thermistor probes. |
| 10 | Upstream and downstream probes partially disconnected or broken. | Reconnect both thermistor probes. |
| 11 | Downstream probe fully and upstream probe partially disconnected or broken. | Reconnect both thermistor probes. |
| 12 | Upstream probe fully disconnected or broken. | Reconnect the upstream thermistor probe. |
| 13 | Upstream probe fully and downstream probe partially disconnected or broken. | Reconnect both thermistor probes. |
| 14 | Upstream probe fully and downstream probe partially disconnected or broken. | Reconnect both thermistor probes. |
| 15 | Upstream and downstream probes fully disconnected or broken. | Reconnect both thermistor probes. |
Table 12: Thermistor Diagnostics Codes
Temperature Rise Diagnostics Codes
| Value | Meaning |
|---|---|
| 0 | Temperature Rise OK |
| 1 | TDIN ERROR |
| 2 | TDOUT ERROR |
| 3 | TDIN + TDOUT ERROR |
| 4 | TUIN ERROR |
| 5 | TUIN +TDIN ERROR |
| 6 | TUIN + TUOUT ERROR |
| 7 | TUIN + TDIN + TDOUT ERROR |
| 8 | TUOUT ERROR |
| 9 | TUOUT + TDIN ERROR |
| 10 | TUOUT + TDOUT ERROR |
| 11 | TUOUT + TDIN + TDOUT ERROR |
| 12 | TUOUT + TUIN ERROR |
| 13 | TUOUT + TUIN + TDIN ERROR |
| 14 | TUOUT + TUIN + TDOUT ERROR |
| 15 | TUOUT + TUIN + TDIN + TDOUT ERROR |
Table 13: Temperature Rise Diagnostics Codes
Detailed Power Information
SFS Power States
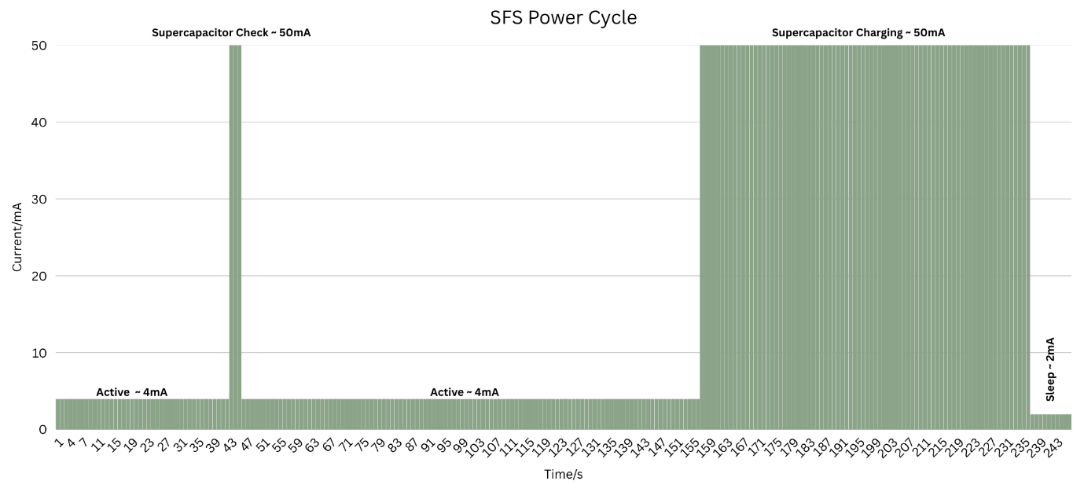
Figure 15: SFS Power Cycle Graph
| SFS States | Description (10-minute Measurement Cycle) |
|---|---|
| Active | ADC Initialization & Baseline Temperature Measurements (1–42 seconds) The sensor powers up its ADC, stabilizes internal electronics, and records baseline temperature values used for HRM calculations. |
| Charging | Supercapacitor Check & Top‑Up (43–45 seconds) The system checks the supercapacitor voltage and adds a small top‑up charge if required. This ensures the capacitor has enough stored energy for the upcoming measurement phase. |
| Active | Measurement, Processing & HRM Calculation (46–156 seconds) The sensor performs the full Heat Ratio Method measurement, processes raw thermal data, and calculates sap flow outputs. This is the highest‑power phase of the cycle. |
| Charging | Supercapacitor Charging Cycle (157–236 seconds) The supercapacitor is fully recharged from the SDI‑12 supply. This prepares the sensor for the next measurement cycle and prevents SDI‑12 current overload. |
| Sleeping | Sleep (237–600 seconds) The sensor enters deep sleep, drawing minimal current. Only essential circuitry remains active until the next cycle begins. |
SFS Power Consumption
Power States |
Active | Supercapacitor Check |
Active | Supercapacitor Charging |
Sleep |
|---|---|---|---|---|---|
| Time (s) | 1-42 | 43-45 | 46-156 | 157-236 | 237-600 |
| Q1 | 0.0467 | ||||
| Q2 | 0.0417 | ||||
| Q3 | 0.1233 | ||||
| Q4 | 1.1111 | ||||
| Q5 | 0.2022 | ||||
| QT | 1.525 mAh for a 10-minute cycle at 12V | ||||
Power (Wh/day) |
2.635 Wh/day for a 10-minute cycle at 12V | ||||
Table 15: SFS Power Consumption at 12V input
The current draw of the sensor differs depending on the input voltage and device state. Empirically measured data on a SFS gave the following results:
| Input (V) | Current when charging supercapacitors (mA) | Current when sensor idle (mA) | Current when sensor asleep (mA) |
|---|---|---|---|
| 9 | 67.5 | 3.66 | 1.84 |
| 12 | 50 | 2.96 | 1.57 |
| 15 | 41 | 2.57 | 1.40 |
| 18 | 35 | 2.30 | 1.30 |
| 21 | 31 | 2.11 | 1.22 |
| 24 | 28 | 1.96 | 1.15 |
Table 16: SFS Current Draw at different input voltages
With a 15-minute measurement interval, using a high-volume measurement command, power consumption can be deduced for a 24hr duration.
| Input (V) | Charging power per measurement (Wh) | Active power per measurement (Wh) | Sleep power per measurement (Wh) | Power per day (Wh) |
|---|---|---|---|---|
| 9 | 0.0206 | 0.0014 | 0.0029 | 2.39 |
| 12 | 0.0203 | 0.0015 | 0.0033 | 2.41 |
| 15 | 0.0208 | 0.0016 | 0.0036 | 2.51 |
| 18 | 0.0214 | 0.0018 | 0.0041 | 2.61 |
| 21 | 0.0221 | 0.0019 | 0.0044 | 2.73 |
| 24 | 0.0228 | 0.0020 | 0.0048 | 2.84 |
Table 17: SFS Power Draw for high volume command
Additional Information
Interchangeable Heater and Thermistor Probes
The heater and thermistor probes are designed to be removable, allowing the sensor to be used across different plant species. Probes can be swapped while the sensor is powered off, and no software adjustments are required. An internal hardware circuit automatically supplies the correct heating energy for the installed heater needle, and the firmware detects which heater is connected. The attached heater needle code is returned as the 7th value in a Heat Ratio Method (HRM) Measurement command but can be more efficiently diagnosed with a Trigger Heat Pulse command (aC2!). The attached thermistor needle diagnostics are similarly returned as the 8th value in a Heat Ratio Method (HRM) Measurement command but can be more efficiently diagnosed with a Raw Thermistor Data command (aC3!).
The SFS offers three needle lengths:
35 mm – suitable for woody stems
22.5 mm – suitable for both woody and herbaceous stems
12 mm – suitable for herbaceous stems with diameters up to 10 mm
These probes, along with their corresponding heaters, are equipped with M8 connectors.
Note: ICT International offers three standard needle sets. Customers can request custom thermistor positions by printing the HRM Needle Design.pdf and aligning it with the desired sapwood profile.
Supercapacitor Bank
The supercapacitor bank is used to store energy for heat pulses. The supercapacitors allow up to 6x SFS devices to be supported on the SDI-12 bus without special power considerations i.e. no need for complicated software management of power or breaking of protocol power standards. The supercapacitors nominally charge to 4.8V. They can be diagnosed with a Supercapacitor Voltage command.
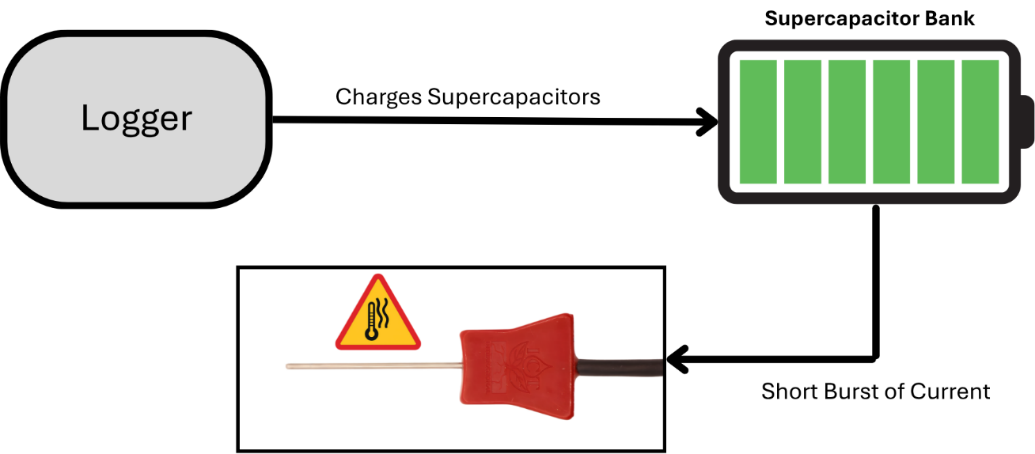
Figure 16: Needle Types
Heater Power Management
A key component of a reliable sap flow sensor is a circuitry that maintains stable and predetermined current flowing through the heater needle. In the SFS, all heater types are driven with a constant current of 0.67 A. The voltage automatically adjusts based on heater resistance:
35 mm (18 Ω): 12.06 V
12 mm (8 Ω): 5.36 V
22.5 mm (13 Ω): 8.71 V
This results in much more consistent power per millimeter across all heater types which is roughly 0.263 W/mm.
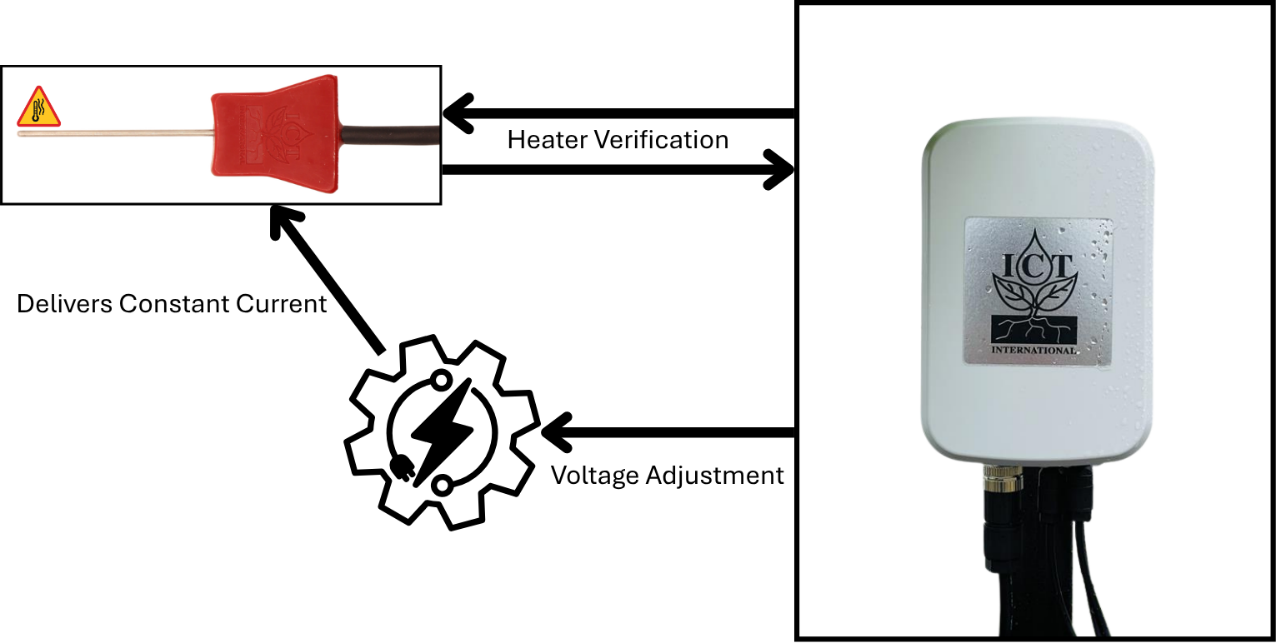
Figure 17: Heater Power Management
Appendix
Enclosure Connector Layout
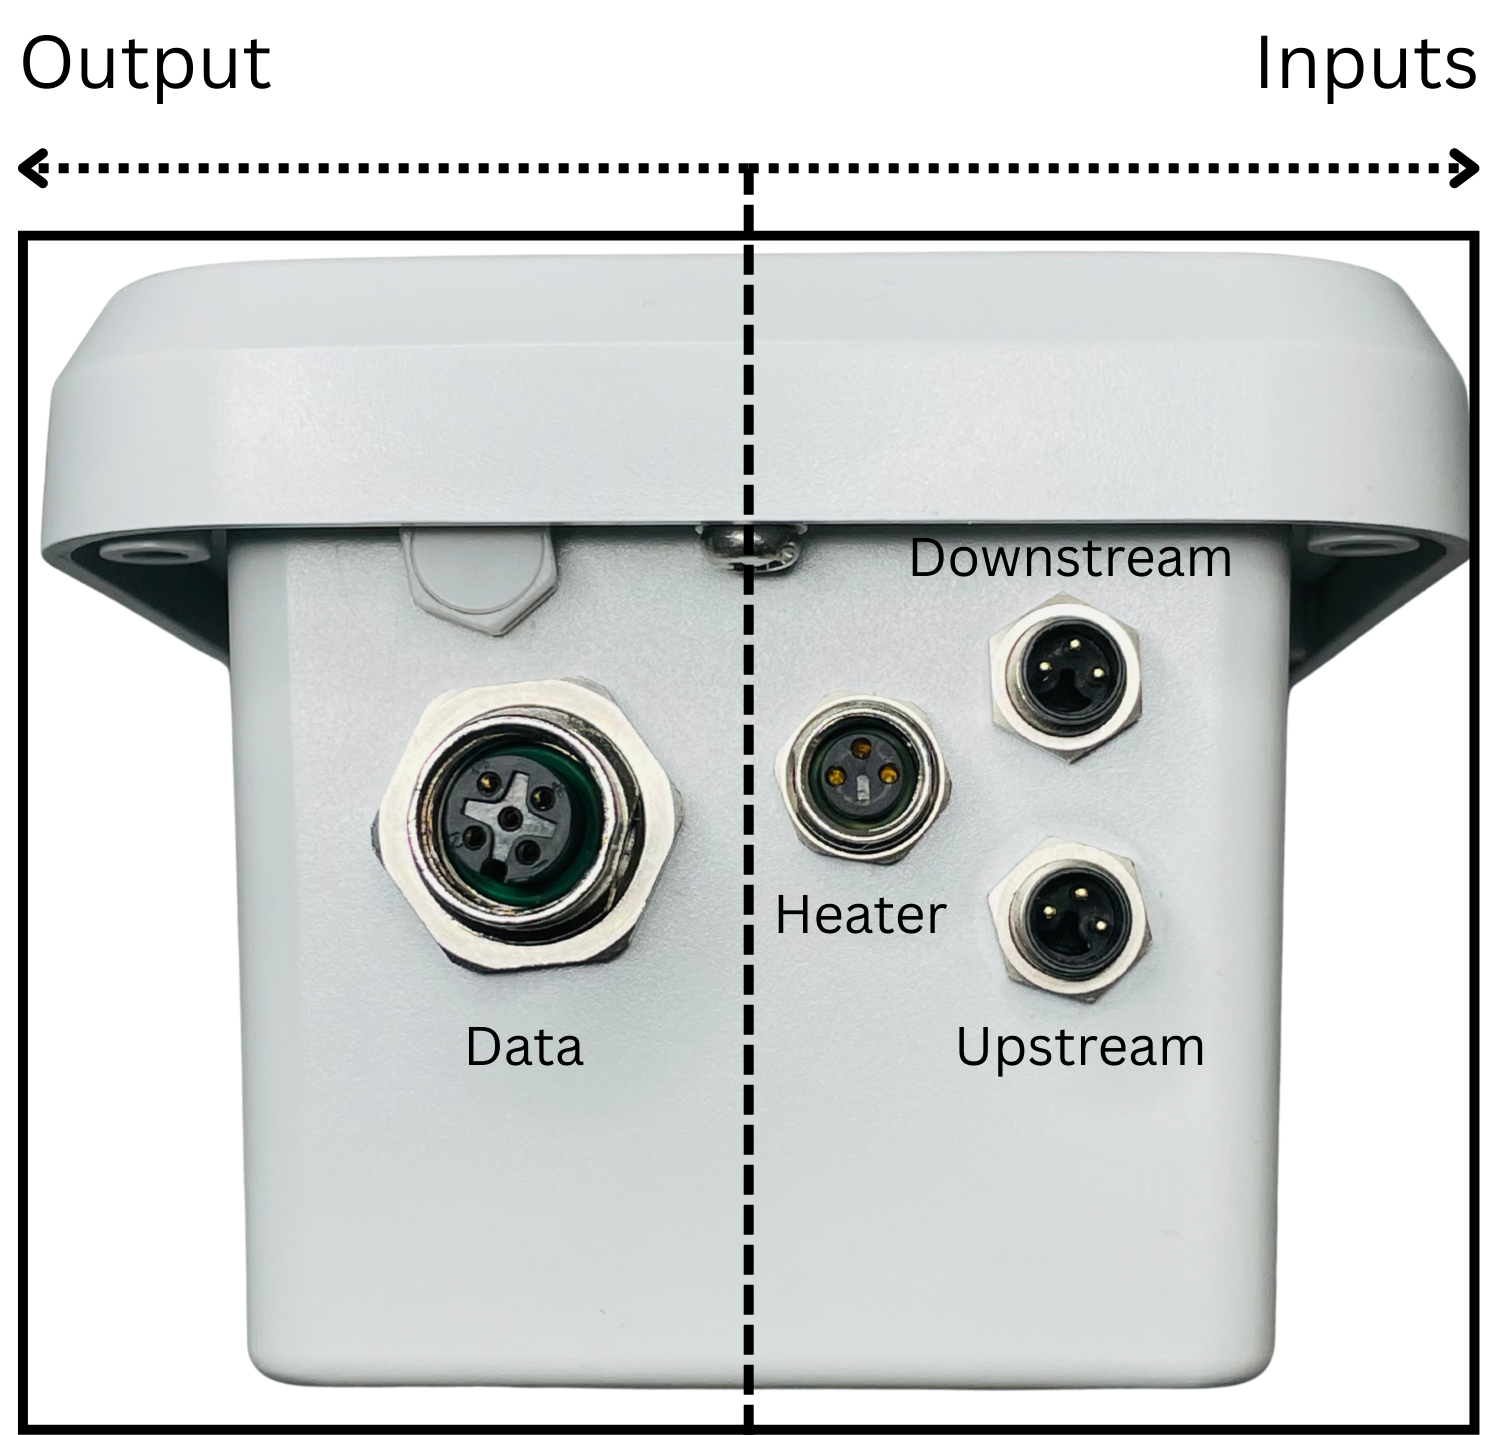
Figure 18: SFS Connector Layout
This diagram shows where each cable connects on the Sap Flow Sensor (SFS). The Data port on the left sends measurements out to the logger, while the three ports on the right are inputs from the probe: Heater (middle connector) powers the constant current heater, and Upstream and Downstream (top and bottom connectors) connect to the two thermistor probes inserted above and below the heater.
Heater Probe Connector Wiring
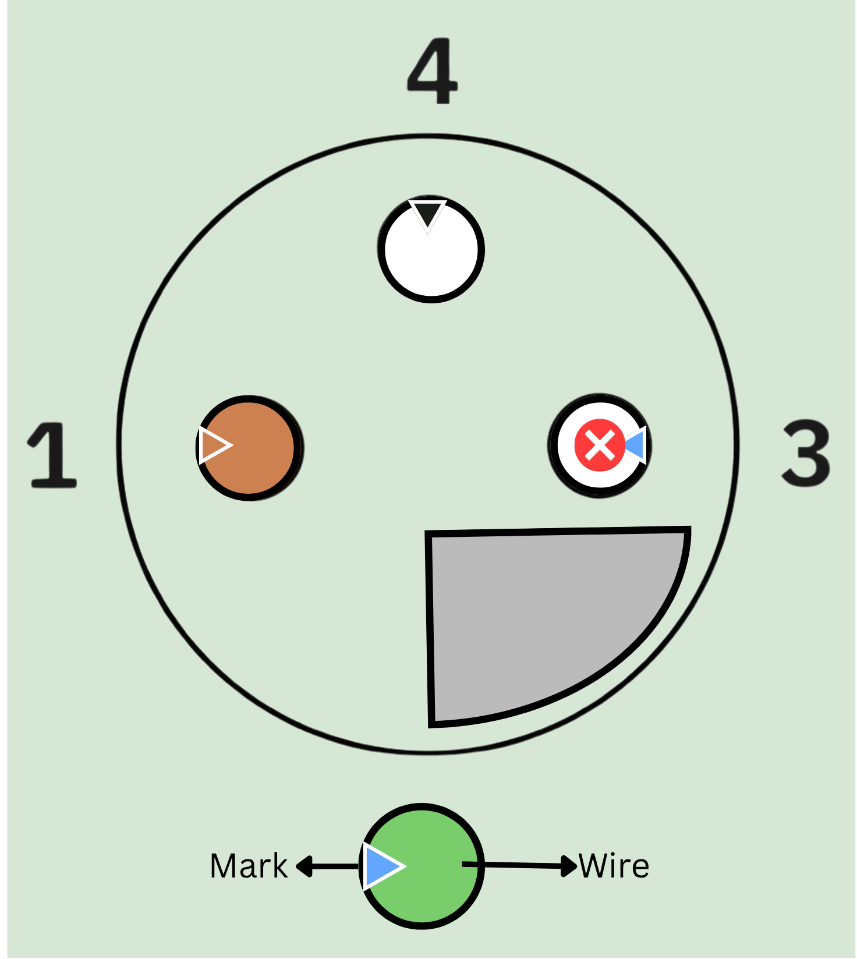
Figure 19: Heater Probe Connector Wiring
Thermistor Probe Connector Wiring
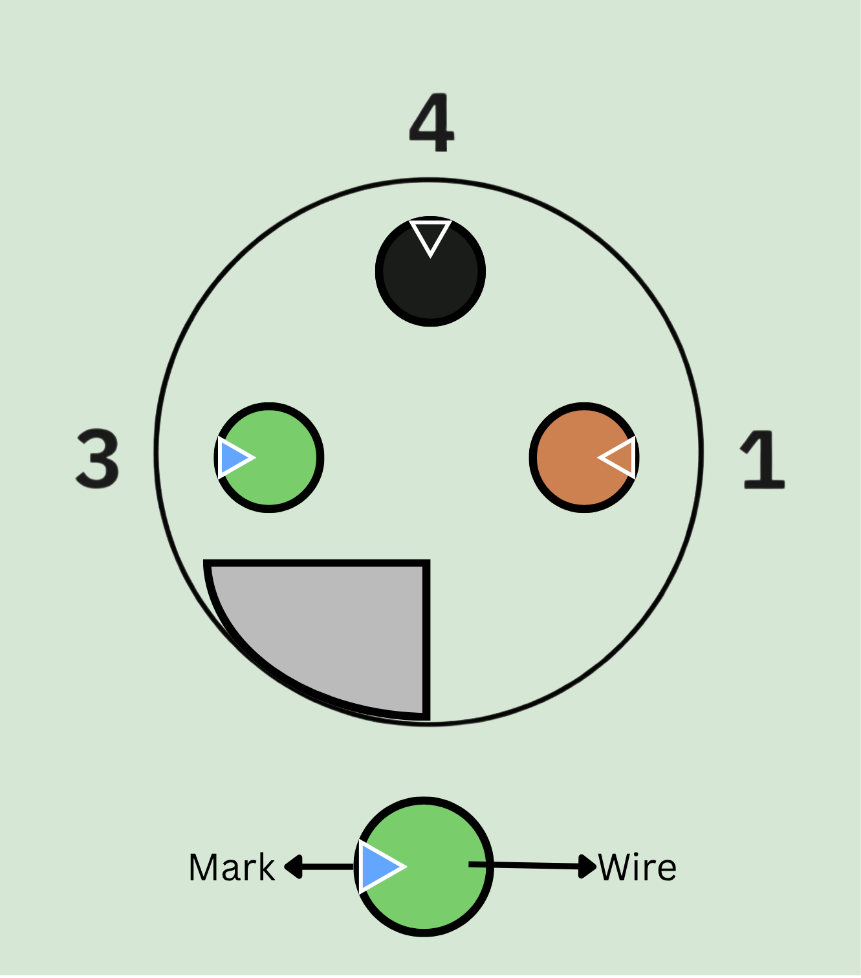
Figure 20: Thermistor Probe Connector Wiring
Cable Connector Wiring
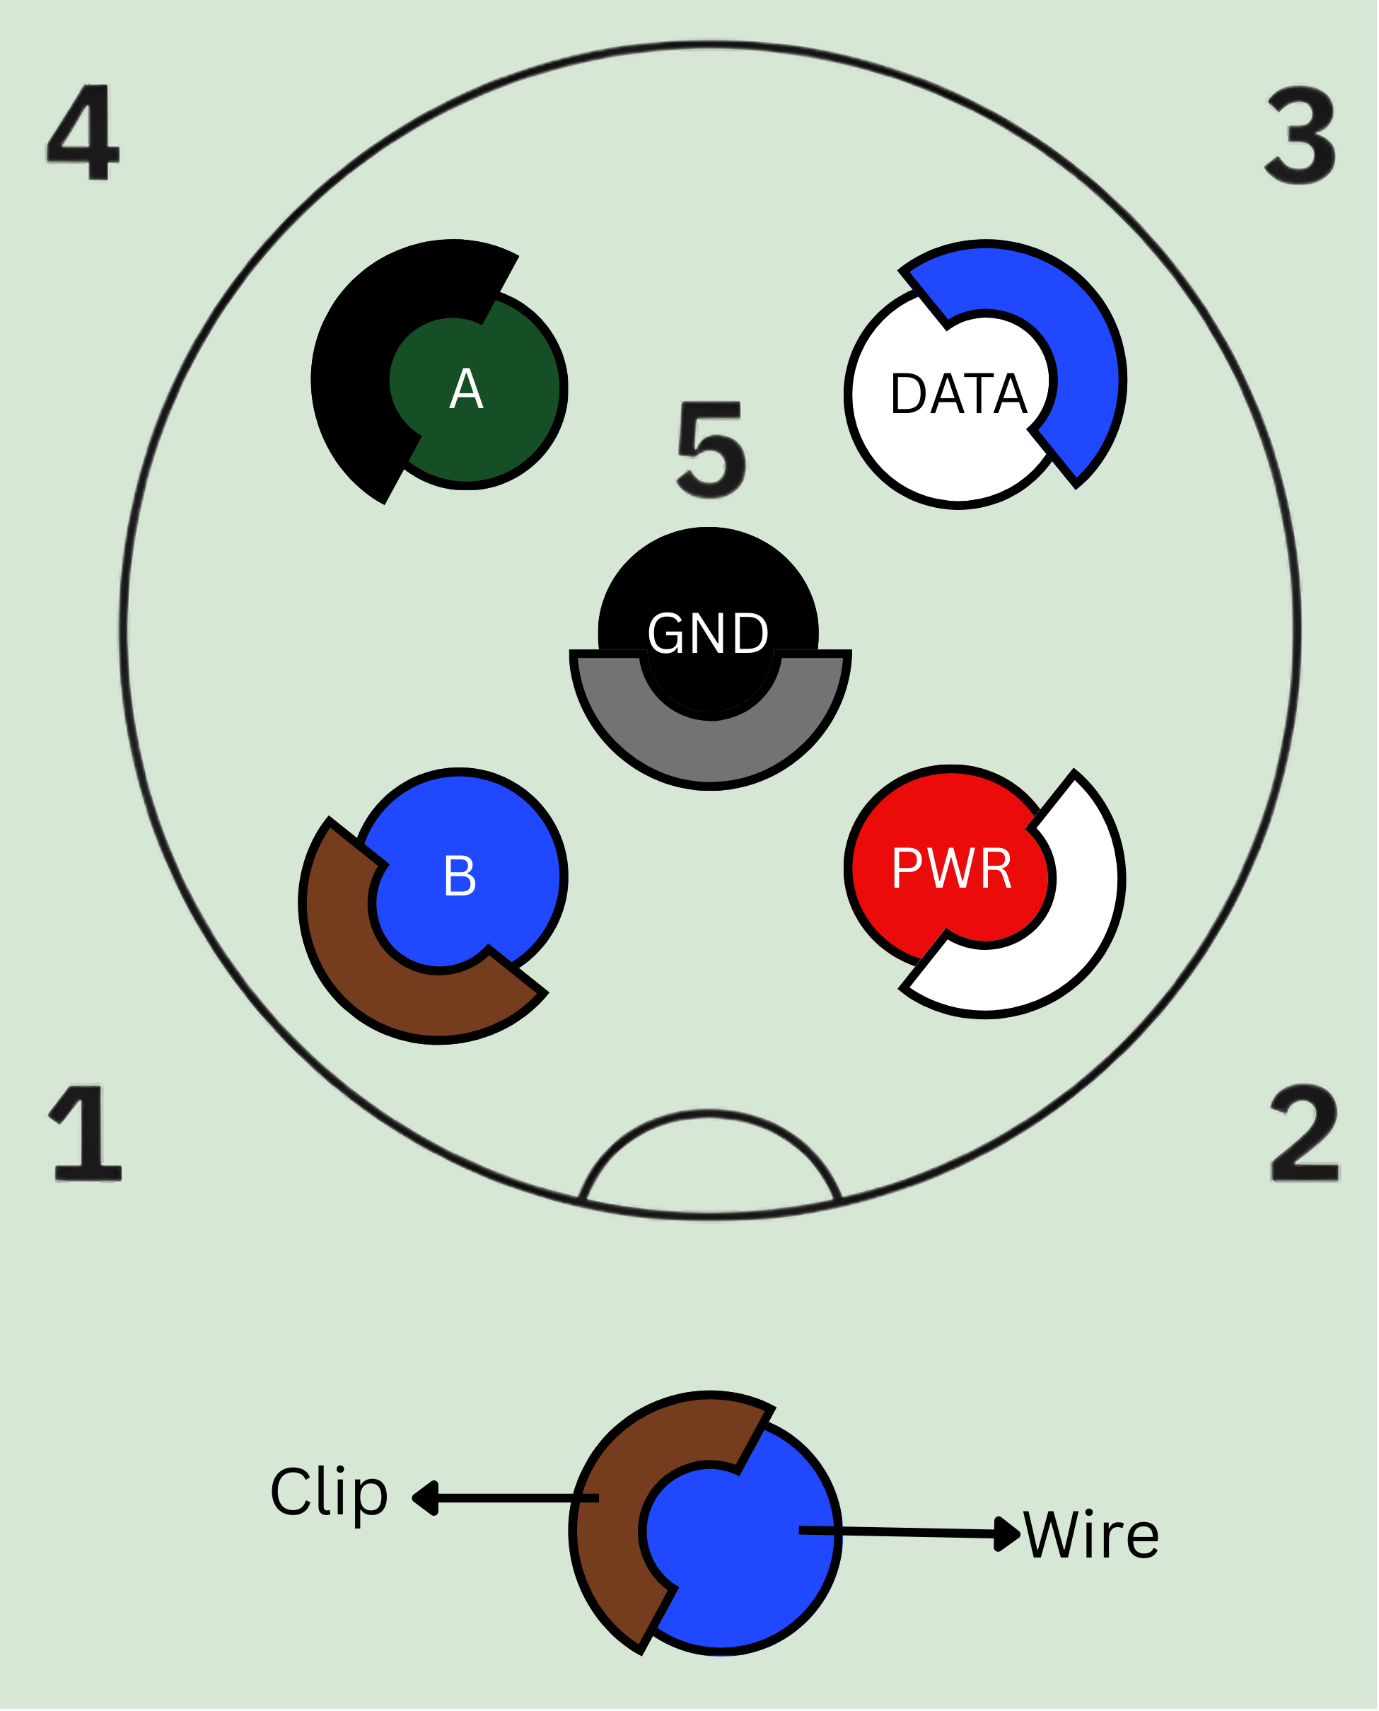
Figure 21: SFS Cable Connector Wiring